
Inputs are inconsistent
Different cost dates, planning bases and return assumptions make side-by-side metrics misleading.
Compare sites and development scenarios against the same strategy, planning, program, financial and risk assumptions—then keep the rationale behind the preferred option visible.
Developer questionWhich opportunity or scenario offers the strongest balance of development potential, return and execution risk?
One sponsor leads with IRR, another with density and another with a planning narrative. Teams spend time normalizing the submission before they can compare the decision.
Different cost dates, planning bases and return assumptions make side-by-side metrics misleading.
A higher return can hide greater approval risk, capital demand or delivery time.
The reason one deal advanced often lives in a meeting rather than the decision record.
Every option is tested against the same organization benchmark and peer set.
Align measurement, cost date, timing, financial assumptions and risk classifications.
Measure each option against program, land basis, return, planning and delivery thresholds.
Show where capacity, return, risk, timing and capital move in different directions.
Keep the preferred option, alternatives and recommendation rationale together.
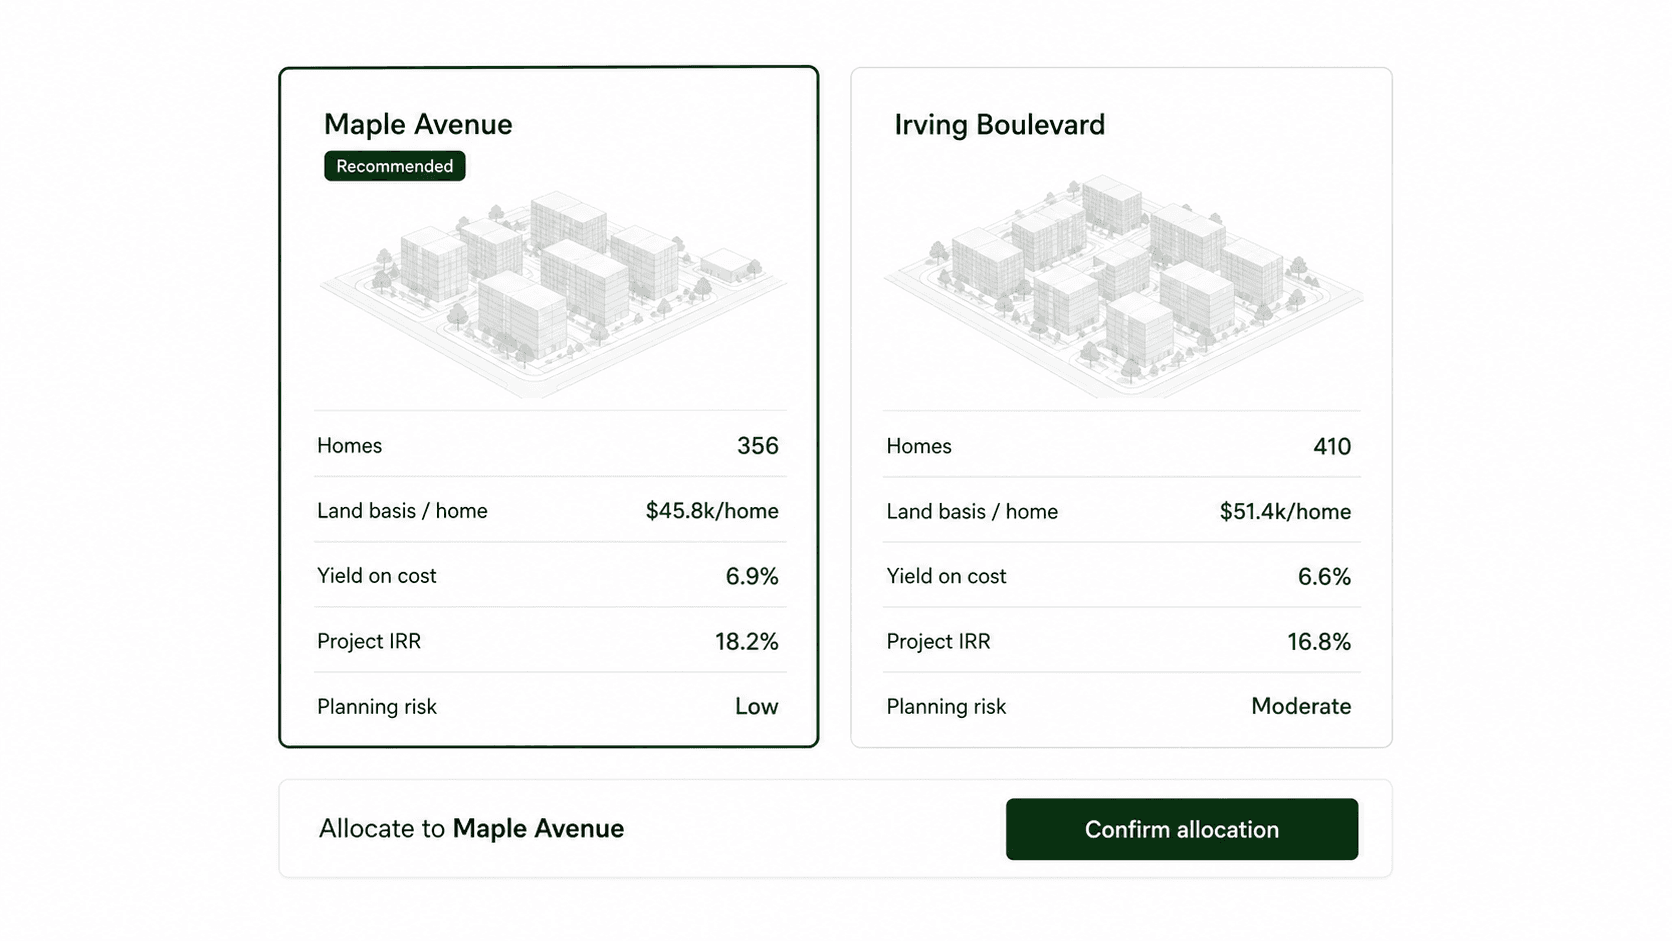
The recommendation shows why Maple Avenue remains preferred even though another site offers a larger headline program.
“Which opportunity or scenario offers the strongest balance of development potential, return and execution risk?”
RecommendationAdvance Maple Avenue and retain Irving Boulevard as the secondary opportunity.
Every result stays connected to the opportunity, the assumptions behind it and the workflow that comes next.
Show the target beside every option rather than relying on memory or narrative.
Compare program, planning, land, return, capital, timing and risk together.
Explain where the preferred option wins and what it gives up.
Keep the selected option, alternatives and conditions available for later review.
Bring qualified judgment into the selected case before the major decision.
Yes. Teams can compare different opportunities, multiple schemes on one site or a selected set using the same decision framework.
Yes. Program, land, return, timing and risk thresholds can reflect the organization’s acquisition strategy.
The comparison updates while preserving the basis and rationale behind earlier versions and decisions.
Bring a live deal, your current assumptions and the decision your team needs to make.